Creating a financial model in Excel isn’t simply a matter of entering the formulas into a spreadsheet, it’s about bringing together historical financial data, business assumptions, and revenue and cost projections into a unified income statement, balance sheet and cash flow statement that all move together. It’s a hands-on, step-by-step tutorial for creating one from a blank workbook.

What Is a Financial Model?
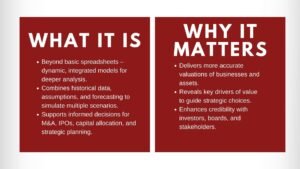
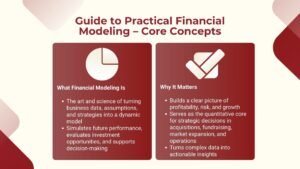
A financial model is a representation of a business’s finances that is structured and then uses assumptions and formulas to predict future financial results. It uses what is known about a business today and turns that into projected revenue, profit and cash flow, via a well-defined series of calculations.
Purpose of a Financial Model
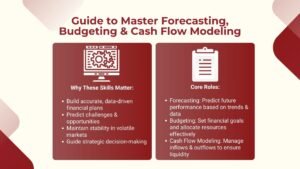
Financial models are commonly used for:
- Budgeting
- Forecasting
- Business planning
- Investment analysis
- Valuation
- Fundraising
- Scenario analysis
- Decision-making
The purpose a model serves determines its structure and level of detail — a quick budgeting model and a fundraising model built for investors will not look the same.
Historical vs Forecast Periods
Historical periods indicate actual, reported financial results. Forecast periods disclose the expected outcomes based on a set of assumptions. Formatting the two parts of the model or using column labels or worksheet layout to clearly demarcate between the known and estimated information helps all users of the model grasp the differences between the two at a quick glance.
Inputs, Calculations and Outputs
Each financial model is composed of three simple elements.
Inputs – Assumptions that feed into the model including revenue growth, pricing, headcount, salary increases, tax rate, capex and working capital assumptions.
Calculations — formulas that turn those assumptions into financial projections.
Outputs — the outputted values like revenue, EBITDA, Net Income, Cash Flow, Debt, Balance Sheet and other important financial values.
What Makes a Model Dynamic?
A dynamic model will automatically update if the assumptions change. Adjust the revenue growth assumption and change in revenue, which then impacts on EBITDA, then net income, then cash flow, then balance sheet. Financial modeling is truly useful for scenario analysis because it is interconnected; that is, it needs to be rebuilt each time there is a change in a question.
What Do You Need Before Building a Model?
A good financial model relies on the information and assumptions that are made in advance of creating the formulas.
Historical Financial Statements
Compile prior income statements, balance sheets and cash flow statements – preferably over several years for which data is available. Look for the following figures:
- Revenue and COGS
- Operating expenses and EBITDA
- Depreciation
- Cash, accounts receivable, and accounts payable
- Debt, equity, and capital expenditure
Historical data provides the foundation for identifying trends and building realistic assumptions.
Business and Operating Assumptions
The starting point of the assumptions should not be the “flat growth rate”, but rather, business drivers: units sold, average selling price, customer counts and growth, headcount, salary per employee, rent, marketing spend, capex, etc.
Driver Based Assumptions are a method of creating a total figure from the underlying elements – whereas Top Down Assumptions are based on a previous period total and then simply apply a growth rate. A driver-based model takes a bit more effort in setting up, but provides a clear line of sight into the reason a number moves a particular way to anyone who reviews the model.
Forecast Period
Typical predictions are of 3, 5 or 10 years duration, and this period is dependent on the model’s purpose. A short-term budgeting model will require only one to three years, whereas a valuation model based on a discounted cash flow will generally require a longer forecast period to account for the business being in a steady state.
Key Financial Drivers
Determine the limited number of variables in operation that are having the largest impact on the financial performance.
- Revenue = Units × Price
- Payroll = Headcount × Average Compensation
- Working Capital = Relevant Operating Drivers
Identifying these drivers up front keeps the model transparent and much easier to update later.
How to Build a Financial Model in Excel Step by Step
This is the main part of the guide. Open a blank Excel spreadsheet and create a spreadsheet as you follow the instructions below.
Step 1 — Set Up the Workbook
Start with a logical workbook structure, using separate worksheets for:
- Assumptions
- Historical Financials
- Revenue Build
- Income Statement
- Balance Sheet
- Cash Flow Statement
- Supporting Schedules
- Outputs / Summary
The formatting and labeling are as important as the formulas themselves. Use dedicated period columns, clear historical/forecast labels, use different formatting for assumption cells, formula cells, check cells, and clear section headers throughout. It’s the same structure that’s being taught in a structured and logical basic financial model in Excel— the point is to be clear, consistent, and auditable, not in a specific color or a specific font.
Step 2 — Enter Historical Data
Enter historical financial information into Excel, organized by period:
| FY2023 | FY2024 | FY2025 | |
| Revenue | $1.0M | $1.2M | $1.4M |
| COGS | $0.6M | $0.7M | $0.8M |
| EBITDA | $0.2M | $0.25M | $0.3M |
Historical data should normally be input as actuals and not formulas based on assumptions, and should be compared with the source financial statements before forecasting is undertaken.
Step 3 — Build Revenue Forecasts
Build a driver-based revenue forecast: Units Sold × Average Selling Price = Revenue.
| 2025A | 2026E | 2027E | |
| Units | 10,000 | 11,000 | 12,100 |
| Price | $100 | $105 | $110 |
| Revenue | $1.0M | $1.155M | $1.331M |
If the unit-growth or pricing changes, so should the revenue of each forecast period. This is a significant example of how a basic financial model can be made dynamic — it is the formula, not the number that causes the forecast to react to a modified assumption.
Step 4 — Forecast Operating Expenses
Use the driver most appropriate to the business economics of the underlying business and NOT a default driver for all lines.
COGS can be modeled as Revenue × COGS %.
Salaries can be modeled as Headcount × Average Salary.
Rent can be modeled based on existing rent, contract escalation, and any new locations.
Marketing can be modeled as Revenue × Marketing %.
Some costs will not always be a percentage of revenue — rent costs and staffing, for instance, are typically better based on other operating factors.
Step 5 — Build the Income Statement
Using the revenue and expense schedules constructed in steps 5 and 6, create a projected income statement, showing revenue, COGS, gross profit, operating expenses, EBITDA, depreciation, EBIT, interest expense, profit before tax, tax, and net income.
Gross Profit = Revenue − COGS
EBITDA = Gross Profit − Operating Expenses
EBIT = EBITDA − Depreciation
Profit Before Tax = EBIT − Interest Expense
Net Income = Profit Before Tax − Tax
Step 6 — Build the Balance Sheet
Predict key balance sheet line items for assets, liabilities, and equity.
Assets: cash, accounts receivable, inventory, and property, plant and equipment.
Liabilities: accounts payable, debt, and other liabilities.
Equity: share capital and retained earnings.
Balance-sheet forecasting often requires supporting schedules. For example:
Accounts Receivable = Revenue × DSO / 365
Accounts Payable = Relevant Expense Base × DPO / 365
The exact formula depends on the business and the modelling convention used, so treat these as starting points rather than fixed rules.
Step 7 — Build the Cash Flow Statement
The cash flow statement is a financial statement that links the income statement and balance sheet, and includes net income, depreciation, working capital changes, capital expenditure, debt movements and financing activities.
Using the indirect method:
Net Income + Non-Cash Expenses −/+ Working Capital Changes − Capex + Financing Movements = Change in Cash
Then cash should go into the balance sheet and the three statements work together as a single model, instead of three separate spreadsheets.
How to Link the Three Financial Statements
In an integrated model, relationships between the income statement, balance sheet and cash flow statement are consistent and consistent and are established using formulas, not re-entered in each schedule.
Revenue → Receivables → Cash
The higher revenue translates to higher accounts receivable, and thus the timing of cash collection and the cash flow effect of this revenue over a period of time.
Capex → Fixed Assets → Depreciation → Cash
Capex will also reduce EBIT over time through depreciation, increasing fixed assets. Depreciation is not a cash flow, it is the original capex, which is a cash flow recorded at the time it is spent.
Debt → Interest → Liabilities → Cash
New debt increases the debt balance, which will then create an interest expense and a cash interest payment, as well as any scheduled debt principal (the principal that is due but not necessarily paid) repayment that will decrease the balance over time.
How to Test a Financial Model
Model construction is just half the task—verifying the accuracy, consistency, logic, formula integrity, and reasonableness of the model is the other half.
Balance-Sheet Check
The total assets minus total liabilities equal equity in an integrated model should be zero. If it is not balanced, examine the formulas instead of plugging the answer into the balance sheet.
Cash-Flow Reconciliation
Net increase or decrease in cash for the period and beginning cash should equal ending cash, and the cash balance on the balance sheet should be equal to ending cash.
Error Checks
Look for incorrect formulas, missing assumptions, negative values, hard-coded numbers within formula rows/columns, inconsistent formulas across periods, and incorrect cell references.
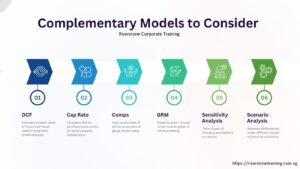
Scenario Testing
Make changes to assumptions like revenue growth, pricing, costs, capex, and interest rates to see how resilient the model’s outputs are to different conditions.
Sensitivity Analysis
Sensitivity analysis illustrates how different assumptions or changes in these assumptions impact on output like EBITDA, net income, cash flow, valuation, and debt coverage.
Common Financial Modeling Errors
Hard-Coded Assumptions
Embedded assumptions within formulas, instead of on an assumptions sheet referred to by formula, make a model difficult to update and prone to failure.
Broken Formulas
Typical errors include misreferenced cells, missing cells, misreferenced ranges, and formula errors when copying a formula across a row or column.
Inconsistent Time Periods
Comparisons across periods become unreliable if the date or the conventions don’t stay the same through the historical and forecast periods in the workbook.
Circular References
A circular reference is where any formula is embedded in the formula for another formula, which in turn is embedded in the formula for the other formula. For instance, interest expense depends on the value of debt, which depends on cash flow, which depends on the value of interest expense. Some will intentionally include circularity with appropriate control, but it is important to understand the issue clearly prior to introducing it.
Poor Model Structure
A model is less believable when assumptions are placed at random, formulas are not clearly explained, there is too much hard-coding, checks are missing, the worksheets are not organized and the same labels are not used to name them. A model should be easy to understand by another finance professional (not just its developer).
How Can Scenario Analysis Improve a Financial Model?
A model can be used to try a base case, which is based on the most probable set of assumptions; an upside case, which assumes a higher revenue growth and/or higher margins; and a downside case, which assumes a lower revenue growth and/or increased costs and/or slower collections.
| Scenario | Revenue Growth | EBITDA Margin | Result |
| Downside | 3% | 15% | Lower profitability |
| Base | 8% | 20% | Expected case |
| Upside | 12% | 23% | Higher profitability |
Each scenario should take into account specific assumptions (not taken from a template).
When Should a Business Use Professional Financial Modeling Training?
Whilst modelling discipline can be learned through the mechanics of Excel, it is possible to structure training to enable development of stronger modelling discipline and more consistent practical application. This can be helpful if you need to:
- Finance professionals moving into FP&A
- Analysts building financial models
- Professionals preparing for investment roles
- Business owners wanting stronger forecasting capabilities
- Teams standardizing financial modelling practices
- Professionals learning valuation modelling
- Finance teams improving scenario analysis
A structured financial modeling course typically covers model architecture, Excel formulas, three-statement modelling, forecasting, scenario analysis, sensitivity analysis, valuation, and model review and error checking. While many programs exist that offer a form of education in financial modelling, programs like NUS’s financial modelling curriculum may give an idea to what the curriculum in this area can look like and include lessons in corporate finance, portfolio, and option pricing and bond modelling in Excel and VBA (although it is not an exhaustive list of good financial modelling curricula). There is no requirement to train to make a working model, but it can cut the learning curve significantly.
Financial Model Excel Structure Checklist
Use this checklist to organize the build from start to finish.
Before Building
☐ Define the purpose of the model
☐ Gather historical financial statements
☐ Identify operating drivers
☐ Define forecast periods
☐ Establish key assumptions
During Construction
☐ Set up clear worksheets
☐ Enter historical data
☐ Build revenue drivers
☐ Forecast operating expenses
☐ Build income statement
☐ Build balance sheet
☐ Build cash flow statement
☐ Link supporting schedules
Before Using the Model
☐ Check balance sheet
☐ Reconcile cash flow
☐ Review formulas
☐ Test scenarios
☐ Run sensitivity analysis
☐ Check assumptions
☐ Review outputs for reasonableness
Conclusion
Creating a financial model in Excel is a very consistent process that includes the following steps: Determine the purpose, collect historical data, determine drivers, make assumptions, make forecasts, create the three statements, connect the three statements, test the model, and run scenarios. A good model is not just a spreadsheet with formulas in it, it should be structured, dynamic, transparent, integrated, testable and easily updatable.
It is more important to know how the model works and why a number changes as a result of a change in the assumption, and how the three statements are related, than to know each of the Excel formulas individually. For those looking to build on these fundamentals more systematically, a structured financial modeling course can help turn this step-by-step process into a repeatable skill.